
The Engineering Cost That Never Shows Up on Your Cloud Bill
Cloud savings are easy to count. Repeated engineering work isn't. Here's how to put both costs on the same page before deciding what to optimize.

Every engineering organization eventually finds its big number. A profiling pass, a cost review or a new FinOps dashboard surfaces an infrastructure optimization worth millions, and the decision feels made before anyone discusses it. The saving is measurable, it shows up on an invoice, and nobody gets fired for cutting the cloud bill. The trouble is that a large, measurable saving and the right priority are two different things, and the gap between them is usually hiding in work nobody has put a number on.
Key Takeaways
- A performance optimization pays in proportion to traffic, which tends to concentrate in a handful of large services. A fix to repeated engineering work pays in proportion to how many services or teams repeat it, which is spread across the long tail.
- Infrastructure savings get funded first because they are visible on an invoice. The cost of repeated engineering work is real but scattered across hundreds of tickets, so it rarely makes the roadmap.
- You can measure that cost. List the tasks almost every service repeats, time them, multiply by frequency, and you have a number that can sit next to the infrastructure one.
- A productivity fix only counts if it becomes a default. "Uncomment one line" is the standard to aim for, and it requires an owned, versioned platform behind it.
- AI-assisted coding moves the constraint rather than removing it. When writing code gets faster, the queue forms in deciding what to build and in security, testing and delivery.
The $20 million optimization that was not the priority
On a recent episode of Engineering Choices You Have to Defend, John Woodyard described exactly this decision from his time working on service frameworks at Amazon. His team had identified infrastructure performance improvements worth roughly $20 million. On paper, an easy call.
The catch was distribution. Across tens of thousands of microservices running very different workloads, the same optimization that made a real difference for a heavyweight like DynamoDB did not translate evenly to everything else. Most services simply did not have the traffic profile to benefit much.
What every one of those services did share was the repetitive work required to build and launch it. The team looked there instead. One example from the conversation: wiring up authentication, authorization and auditing for a new service had taken roughly two weeks. They reduced it to, in John's words, essentially uncommenting a line of code. By his account, that one change contributed more than $2 million in savings in its first three months.
The lesson is not "productivity beats performance." John is explicit that the right optimization depends on the business constraint, and sometimes performance is the constraint. The lesson is that you cannot know which one is bigger until you measure both with the same seriousness.
Why infrastructure savings usually get funded first
Performance work has a structural advantage in any prioritization meeting. Its cost lives in one place, the cloud invoice, and its saving shows up in the same place next month. Finance can see it. The CTO can put it on a slide.
The cost of repeated engineering work has the opposite shape. It is spread across hundreds of tickets, dozens of teams and a calendar full of "setup" tasks nobody tracks as a category. Each instance is small enough to look like normal work. Nobody files a ticket that says "we spent another two weeks wiring auth into a new service, yet again, exactly like last time." The cost is real, it just never aggregates into a number someone owns.
That asymmetry is why the two options rarely get compared fairly. The diagram below shows why they behave so differently even before you count anything.
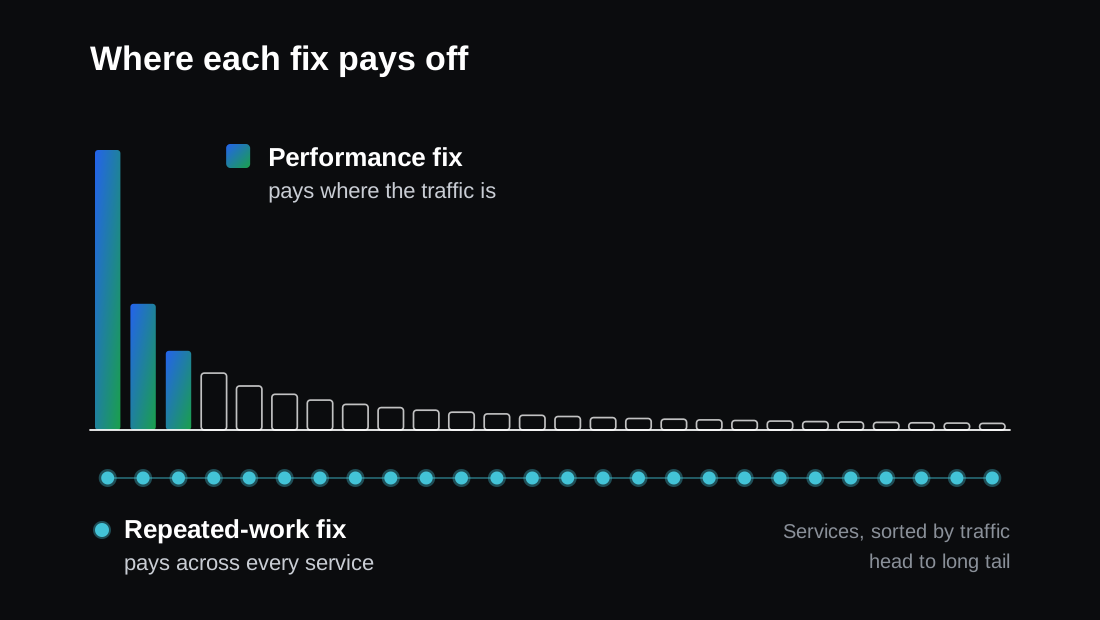
In a distributed system with many services, traffic usually follows a steep curve. A per-request optimization pays off where the requests are, at the head. A per-service fix pays off once for every service that would otherwise repeat the work, including the long tail that a performance project never touches.
Run a task census before you pick
Making the comparison fair means putting a number on the scattered work. Google's SRE book has a useful vocabulary for it: toil, work that is "manual, repetitive, automatable, tactical, devoid of enduring value," and that scales linearly as a service grows. Google's SRE organization advertises a goal of keeping that operational work below 50% of each SRE's time, so that at least half goes to engineering work that will either reduce future toil or add service features. That is toil treated as a budget line with a ceiling, not as background noise.
A task census applies the same thinking to building and launching services, not just running them:
- List the tasks almost every service repeats. Auth and authorization, audit logging, CI pipeline setup, observability wiring, secrets handling, deployment configuration, security review prep. Ask the engineers, not the managers. They know which steps they copy from the last repo.
- Time one honest occurrence of each. Not the ideal path. The real one, including the waiting on another team and the second attempt after review.
- Multiply by frequency. How many new services, major changes or onboarded teams hit this task per quarter?
- Convert to cost. Engineer time at a loaded rate, plus the delay cost when the task sits on a launch's critical path.
- Put the result next to the infrastructure number. Same units, same horizon, same meeting.
John's team measured productivity in a similar way: identifying the common tasks engineers performed across most services, calculating the time spent on them, and translating that into business value. None of this needs a new metrics platform. A spreadsheet and a week of interviews will get you a defensible first estimate, and an outside software audit can do the same exercise without the internal politics of who owns which slow step.
What "uncomment one line" actually requires
The two-weeks-to-one-line result is the part leaders tend to underestimate. It is not a script someone wrote on a Friday. For a default to be that cheap to adopt, a few things have to be true:
- It is secure and correct by default. Teams opt in by doing nothing clever. If enabling auth still requires reading a forty-page wiki, you have moved the toil, not removed it.
- It is owned. A named team maintains it, patches it and answers for it. Unowned shared libraries turn into the next layer of repeated work.
- It is versioned and upgradeable. Services can take fixes without a migration project each time.
- It encodes your architecture, not just your boilerplate. The default reflects how your services are meant to talk to each other, which is a software architecture decision before it is a tooling one.
The one line is not the achievement. Everything behind it is. Someone has already made the architecture, security and maintenance decisions that every service would otherwise make for itself. The productivity gain comes from making those decisions once and encoding them into the default.
This is also where the comparison with performance work becomes uncomfortable. A performance optimization can often be delivered by a small expert team without anyone else changing behavior. A productivity default only pays when teams actually adopt it, which means it has to be easier than the workaround. Build it like a product, with its own users.
AI moves the constraint, it does not remove it
The episode's sharpest point is about where this goes next. As AI makes it possible to generate code faster, John argues the bottleneck moves: upstream toward deciding what should be built, and downstream toward security, testing, scanning and software delivery.
The DORA research program found a more complicated picture than "AI makes software delivery faster." Its 2024 DORA report links higher AI adoption to gains in individual productivity, flow and job satisfaction, and also to worse software delivery stability and throughput. DORA does not frame that as a moving bottleneck. That part is our reading: faster code generation does not automatically mean faster delivery. It can mean a bigger queue in front of the slowest stage you already had.
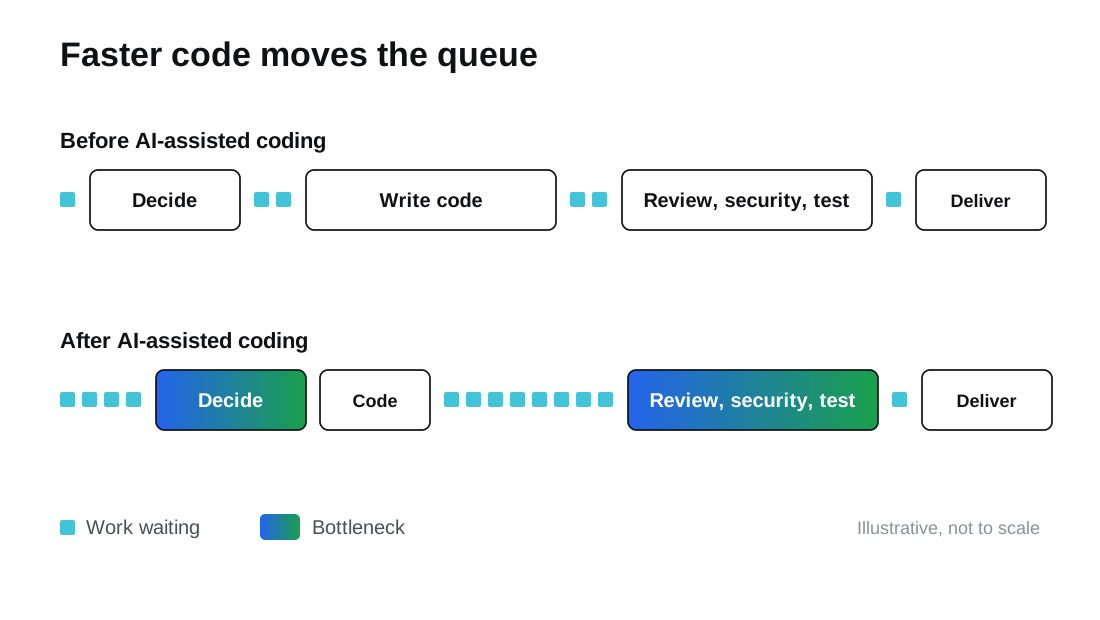
For a task census, this means the list changes once your teams adopt AI-assisted development. Code writing drops down the list. Security review, test creation, pipeline time and the back-and-forth over unclear requirements move up. If your platform defaults do not cover those stages, AI will make them the new two-week tax.
A decision rule for your next optimization quarter
Before you commit next quarter's platform budget to the biggest number on the dashboard, answer these questions in order:
- What is the business constraint right now? Margin, launch speed, reliability or headcount. Performance and productivity solve different ones.
- Where does the saving accrue? At the head of your traffic curve, or across every team and service?
- Have you counted the repeated work? If the answer is no, the infrastructure number is winning by default, not on merit.
- Can the fix become a default? If adoption depends on every team doing extra work, discount the projected saving hard.
- Where will the queue move next? Especially if AI tooling is rolling out, plan for the stage that becomes slow after this one is fixed.
Sometimes the answer will still be the $20 million performance project, and that is a good outcome if you got there by comparing it honestly. What matters is defending the choice with both numbers on the table. This kind of task census is one of the things we look at during a Code Particle software audit, before recommending where the engineering investment should go.